class: center, middle, inverse, title-slide .title[ # Occupancy Modeling Workshop ] .subtitle[ ## OTS 2022 ] .author[ ### Diego J. Lizcano, Ph.D. ] .institute[ ### SCMAS, Awake-Travel ] .date[ ### 2022-06-26 ] --- background-image: url(http://tropicalstudies.org/wp-content/uploads/2019/01/logo.png) --- class: center, middle # Thanks to ## Adriana Bravo ## Pablo Muñoz ## Sofía Rodríguez-Brenes --- class: inverse, center, middle # Get Started --- class: inverse, center # Diego J. Lizcano  -- - Biologist. Universidad de los Andes, Bogotá-Colombia. -- - Ph.D. University of Kent, Canterbury, UK. -- - Ecology and conservation of mammals (Tapirs). --- class: inverse, center, middle # Now You... --- # In this workshop: We are going to use  And strongly recommended to use  --- class: center, top, inverse # Ecology ### Charles Krebs  --- # Ecology: Study of interactions that determine **Distribution and Abundance** .left-column[  ] .right-column[ ### Distribution: Where are they. ### Abundance: How many?. ] -- Related to the problem of counting organisms! -- --- # Counting animals is not a trivial problem...  Animals move! --- ### As ecologist: The map of our dreams  #### at some point, we had to count the kangaroos --- # Conting Animals  #### Easy for animals that are conspicuous and that group together. --- # Conting Animals  #### Not so easy if they don't group. Capture - Mark - Recapture. Distance --- # Conting Animals  #### For some species it is cumbersome, impractical and very expensive. --- ### Relative abundance  #### An indicator variable of the state of the population I don't know how many there are, but I do know where there are more and where there are less. --- # However...  #### Animals move and hide (camouflage) --- class: center # Sampling is not infallible  Biologist are not super heroes. We make mistakes! #### Detectability and Imperfect detection concept --- # Detectability depends of -- ## 1. Sampling conditions (weather, time). -- ## 2. The ability of the observer (sensor). -- ## 3. The biology of the species being sampled. -- ### This error should be considered carefully to avoid bias in abundance estimates. --- # How the detection error occurs (Guillera‐Arroita 2016) see ppt 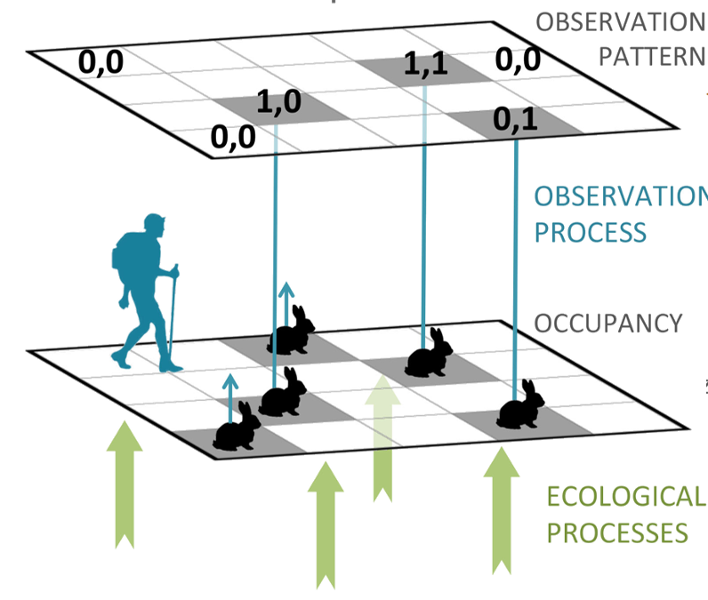 ##### It is an important error that must be considered in the sampling design!!! --- # Mackenzie et al 2002, 2003 to the rescue 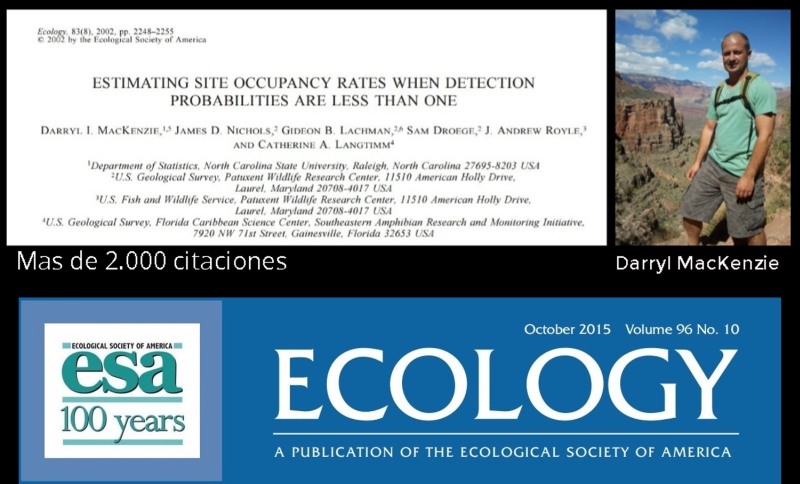 unnoticed... --- # Book and presence program 2006 .left-column[ 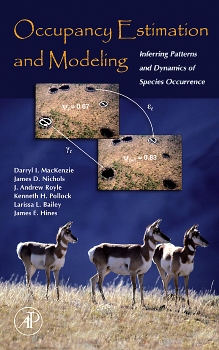 ] .right-column[ 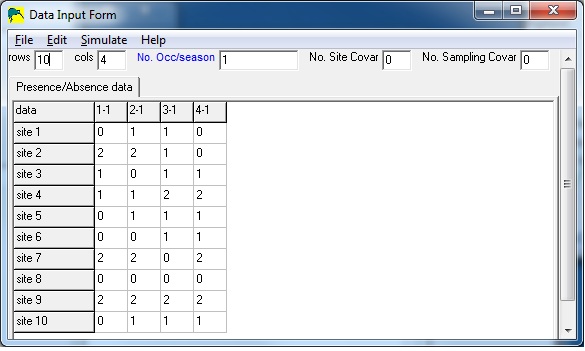 ] Mackenzie popularizes occupancy `\((\psi)\)` as a proxy of abundance taking into account detectability `\((p)\)` --- ## Allows you to set goals and to monitor them over time. 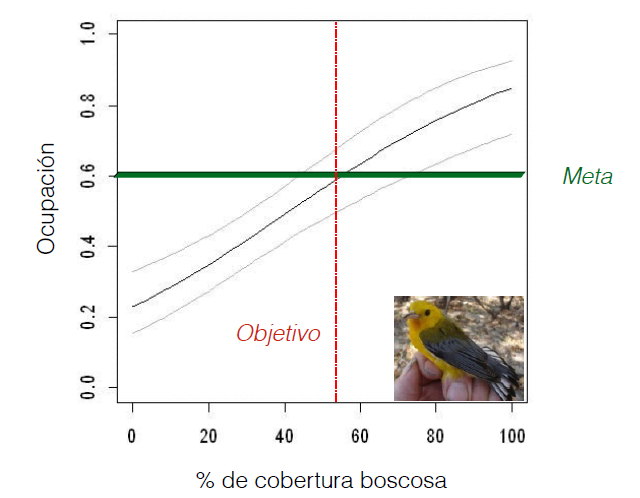 --- class: inverse, middle, center ## Occupancy # `$$\psi$$` ## Detection probability # `$$p$$` ### Occupancy is a reflection of other important population parameters such as density. --- ## 1. `\((\psi)\)` is the proportion of the sampled area that is occupied by the species. ## 2. By visiting the site several times I can be more sure that I detect the species when it is found in that place. ## 3. **Repeated sampling** are key. ## `\((\psi)\)` It is influenced by environmental variables (**Covariables**) such as vegetation cover, altitude, precipitation, etc. --- # This is what a data table with repeated sampling should look like | | visit1| visit2| visit3| visit4| |:-----|------:|------:|------:|------:| |site1 | 1| 0| 0| 1| |site2 | 0| 0| 0| 0| |site3 | 1| 1| 0| 0| |sitex | 0| 0| 0| 0| --- # Example calculating `\(\psi\)` and `\(p\)` ### Frequentist method (Maximum likelihood) .pull-left[ | | v 1| v 2| v 3| v 4| |:---|---:|---:|---:|---:| |s 1 | 1| 0| 0| 1| |s 2 | 0| 0| 0| 0| |s 3 | 1| 1| 0| 0| |s x | 0| 0| 0| 0| ] .pull-right[ | **Detection History** | |----------------------------------------| | `\(H_{1} \psi\)` × p1(1-p2)(1-p3)p4 | | `\(H_{2} \psi\)` × (1-p2)(1-p2)(1-p3)(1-p4)p4 | | `\(H_{3} \psi\)` × p1p2(1-p3)(1-p4) | | `\(H_{4} \psi\)` × (1-p2)(1-p2)(1-p3)(1-p4)p4 | ] ### Histories Combined in a Model: $$ `\begin{aligned} L(\psi, p \mid H_{1},...,H_{x}) = \prod_{i=1}^{x} Pr (H_{i}) \end{aligned}` $$ -- The model admits incorporating covariates to explain `\(\psi\)` and `\(p\)` -- --- # Same example calculating `\(\psi\)` and `\(p\)` ### Bayesian method .pull-left[ | | v 1| v 2| v 3| v 4| |:---|---:|---:|---:|---:| |s 1 | 1| 0| 0| 1| |s 2 | 0| 0| 0| 0| |s 3 | 1| 1| 0| 0| |s x | 0| 0| 0| 0| ] .pull-right[ It is important to understand that there are two processes that can be modeled hierarchically - The ecological process ($\psi$) follows a Bernoulli distribution. - The observation model ($p$) follows a Bernoulli distribution. The probability of observing the species given that it is present: `\(p = Pr(y_{i}=1 \mid z_{i}=1)\)` The Occupancy probability: `\(\psi =Pr(z_{i}=1)\)` ] --- ### A hierarchical (Bayesian) model 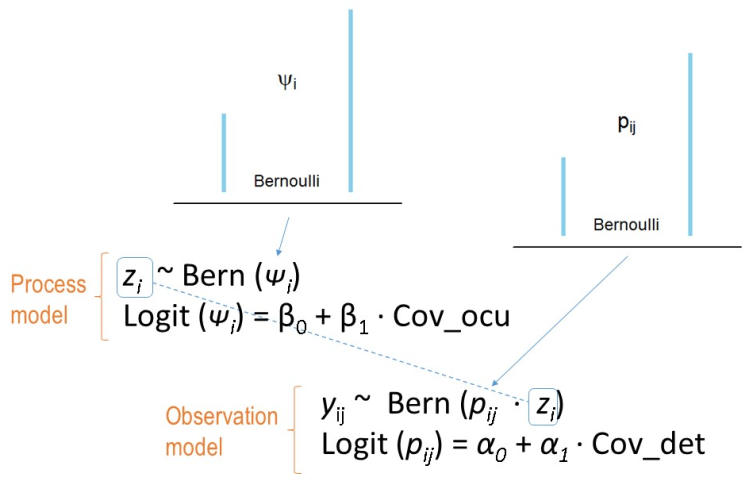 ### Admits Covariates --- ## Which one should I use? The maximum likelihood or Bayesian? .pull-left[ ML - Package [unmarked](https://cran.r-project.org/web/packages/unmarked/index.html) - In R - Admits "automatic" model selection AIC - Problems with many NAs - Hesian problem. estimates ok. - Difficulty from 1 to 10: 3 if you already know R. ] Bayesian .pull-right[ - BUGS or Stan language, called from R - Model selection is not that easy, BIC is not suitable - You don't have as many problems with many NAs in the matrix - Estimates are more accurate. - Difficulty from 1 to 10: 7 if you already know R. ] --- class: middle, center # Going Deep  ### Andy Royle (2008) Advanced level book with lots of details, formulas, examples and code in R and BUGS language. --- # Dragon-fly book (2015) .pull-left[ 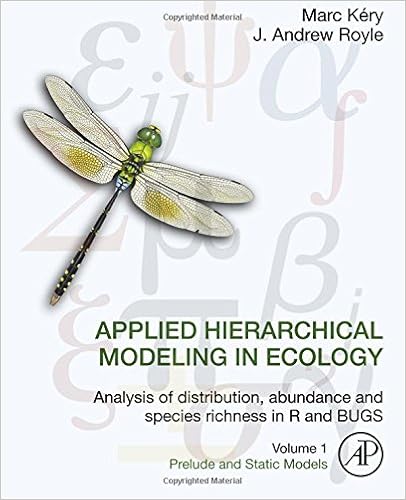 ] .pull-right[ ### More recent by [Marc Kery](http://store.elsevier.com/Marc-Kery/ELS_1059944/) More than 700 pages clearly explaining where the theory comes from, in a tutorial style, starting with a basic level of R to advanced models and their implementation in R and the BUGS language. ] --- background-image: url(img/baby-84626_1280.jpg) background-size: contain # Let's do it!  - R level? - Objects?, Vectors? - DataFrame? - Loops? - Functions? --- # Schedule .left-column[  ] .right-column[ | Day | Topic | |-----------------|------------------------------------------------------| | Tuesday 28 pm | Remembering R | | | [R as model tool](https://dlizcano.github.io/IntroOccuPresent/R_toModel_E.html) | | Wednesday 29 am | [Occupancy concept](https://dlizcano.github.io/IntroOccuPresent/modelOccuData_E.html) | | | Intro Occu Static model - [unmarked101](https://dlizcano.github.io/IntroOccuPresent/unmarked_101_E.html) | | Wednesday 29 pm | Static Model in deep I- [Sim Machalilla](https://dlizcano.github.io/occu_book/) | | | Static Model in deep II- [Data in unmarked](https://dlizcano.github.io/occu_book/unmarked.html) | | Thursday 30 am | Questions. Real World Data - [Deer](https://github.com/dlizcano/Mazama_rufina) | | | [More models](https://dlizcano.github.io/IntroOccuPresent/Otros_modelos_jerarquicos.html) | ] --- class: bottom, center background-image: url(img/children-593313_1280.jpg) background-size: cover # Thanks! Slides created via the R package [**xaringan**](https://github.com/yihui/xaringan). Contact: Diego J. Lizcano <a href="http://twitter.com/dlizcano"> <svg aria-hidden="true" role="img" viewBox="0 0 512 512" style="height:1em;width:1em;vertical-align:-0.125em;margin-left:auto;margin-right:auto;font-size:inherit;fill:steelblue;overflow:visible;position:relative;"><path d="M459.37 151.716c.325 4.548.325 9.097.325 13.645 0 138.72-105.583 298.558-298.558 298.558-59.452 0-114.68-17.219-161.137-47.106 8.447.974 16.568 1.299 25.34 1.299 49.055 0 94.213-16.568 130.274-44.832-46.132-.975-84.792-31.188-98.112-72.772 6.498.974 12.995 1.624 19.818 1.624 9.421 0 18.843-1.3 27.614-3.573-48.081-9.747-84.143-51.98-84.143-102.985v-1.299c13.969 7.797 30.214 12.67 47.431 13.319-28.264-18.843-46.781-51.005-46.781-87.391 0-19.492 5.197-37.36 14.294-52.954 51.655 63.675 129.3 105.258 216.365 109.807-1.624-7.797-2.599-15.918-2.599-24.04 0-57.828 46.782-104.934 104.934-104.934 30.213 0 57.502 12.67 76.67 33.137 23.715-4.548 46.456-13.32 66.599-25.34-7.798 24.366-24.366 44.833-46.132 57.827 21.117-2.273 41.584-8.122 60.426-16.243-14.292 20.791-32.161 39.308-52.628 54.253z"/></svg> <a href="http://github.com/dlizcano"> <svg aria-hidden="true" role="img" viewBox="0 0 496 512" style="height:1em;width:0.97em;vertical-align:-0.125em;margin-left:auto;margin-right:auto;font-size:inherit;fill:black;overflow:visible;position:relative;"><path d="M165.9 397.4c0 2-2.3 3.6-5.2 3.6-3.3.3-5.6-1.3-5.6-3.6 0-2 2.3-3.6 5.2-3.6 3-.3 5.6 1.3 5.6 3.6zm-31.1-4.5c-.7 2 1.3 4.3 4.3 4.9 2.6 1 5.6 0 6.2-2s-1.3-4.3-4.3-5.2c-2.6-.7-5.5.3-6.2 2.3zm44.2-1.7c-2.9.7-4.9 2.6-4.6 4.9.3 2 2.9 3.3 5.9 2.6 2.9-.7 4.9-2.6 4.6-4.6-.3-1.9-3-3.2-5.9-2.9zM244.8 8C106.1 8 0 113.3 0 252c0 110.9 69.8 205.8 169.5 239.2 12.8 2.3 17.3-5.6 17.3-12.1 0-6.2-.3-40.4-.3-61.4 0 0-70 15-84.7-29.8 0 0-11.4-29.1-27.8-36.6 0 0-22.9-15.7 1.6-15.4 0 0 24.9 2 38.6 25.8 21.9 38.6 58.6 27.5 72.9 20.9 2.3-16 8.8-27.1 16-33.7-55.9-6.2-112.3-14.3-112.3-110.5 0-27.5 7.6-41.3 23.6-58.9-2.6-6.5-11.1-33.3 2.6-67.9 20.9-6.5 69 27 69 27 20-5.6 41.5-8.5 62.8-8.5s42.8 2.9 62.8 8.5c0 0 48.1-33.6 69-27 13.7 34.7 5.2 61.4 2.6 67.9 16 17.7 25.8 31.5 25.8 58.9 0 96.5-58.9 104.2-114.8 110.5 9.2 7.9 17 22.9 17 46.4 0 33.7-.3 75.4-.3 83.6 0 6.5 4.6 14.4 17.3 12.1C428.2 457.8 496 362.9 496 252 496 113.3 383.5 8 244.8 8zM97.2 352.9c-1.3 1-1 3.3.7 5.2 1.6 1.6 3.9 2.3 5.2 1 1.3-1 1-3.3-.7-5.2-1.6-1.6-3.9-2.3-5.2-1zm-10.8-8.1c-.7 1.3.3 2.9 2.3 3.9 1.6 1 3.6.7 4.3-.7.7-1.3-.3-2.9-2.3-3.9-2-.6-3.6-.3-4.3.7zm32.4 35.6c-1.6 1.3-1 4.3 1.3 6.2 2.3 2.3 5.2 2.6 6.5 1 1.3-1.3.7-4.3-1.3-6.2-2.2-2.3-5.2-2.6-6.5-1zm-11.4-14.7c-1.6 1-1.6 3.6 0 5.9 1.6 2.3 4.3 3.3 5.6 2.3 1.6-1.3 1.6-3.9 0-6.2-1.4-2.3-4-3.3-5.6-2z"/></svg> ---