| visit1 | visit2 | visit3 | visit4 | |
|---|---|---|---|---|
| site1 | 1 | 0 | 0 | 1 |
| site2 | 0 | 0 | 0 | 0 |
| site3 | 1 | 1 | 0 | 0 |
| sitex | 0 | 0 | 0 | 0 |
Ocupación
Salvador Mandujano

Diego J. Lizcano

Biólogo Universidad de los Andes, Bogotá-Colombia.
Ph.D. University of Kent, Canterbury, UK.
Ecología y Conservación de Mamíferos .
Especie favorita: Tapires.
En este Curso:
Vamos a usar:
Y les recomiendo tambien usar:
Ecología: Charles Krebs
Ecología: Study of interactions that determine Distribution and Abundance
Contar animales no es un problema trivial…

Los animales se mueven!
Como ecologo, el mapa de los sueños!
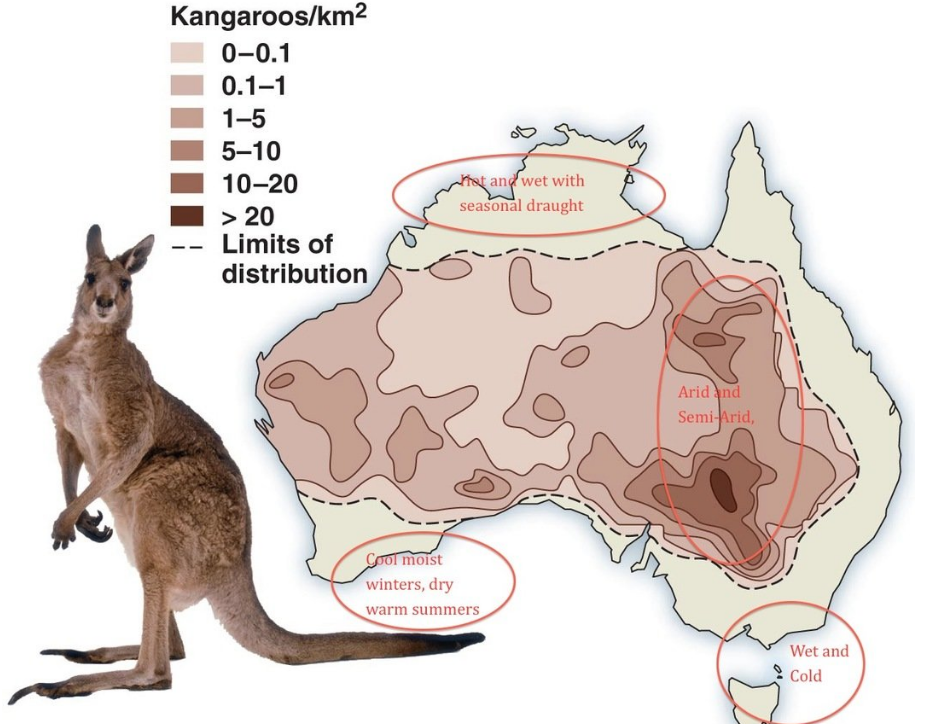
En algún punto tuvimos que contar los canguros
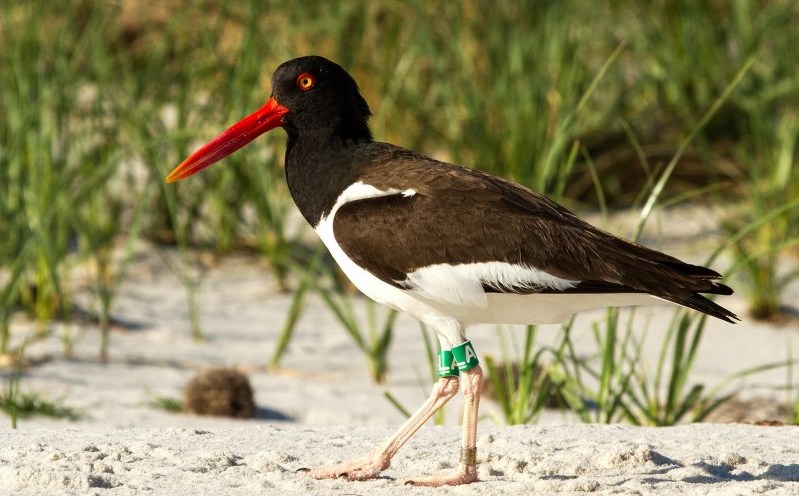
Contar Animales
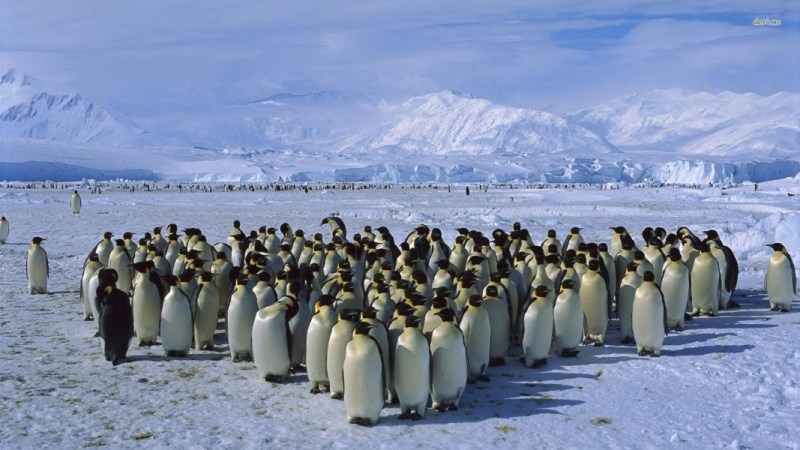
Fácil para animales conspicuos que no se mueven
Contar Animales
No tan facil si no se agrupan y se dispersan. Captura-marca-recaptura
Contar Animales
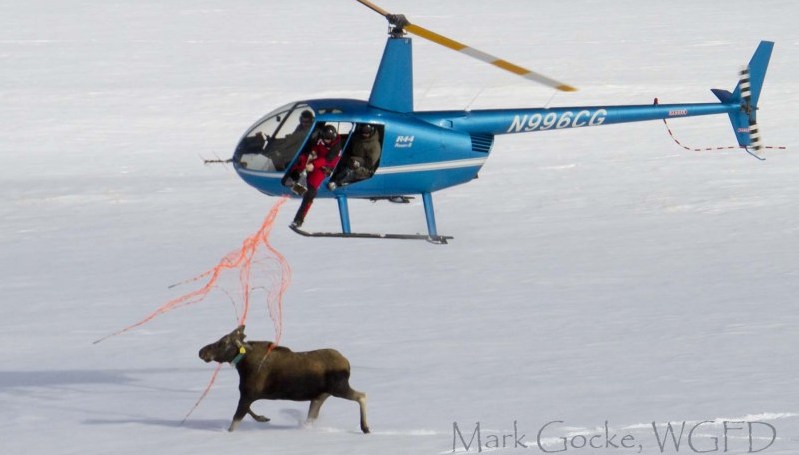
Para algunas especies Captura-marca-recaptura es demasiado costoso o impractico.
Relative abundance
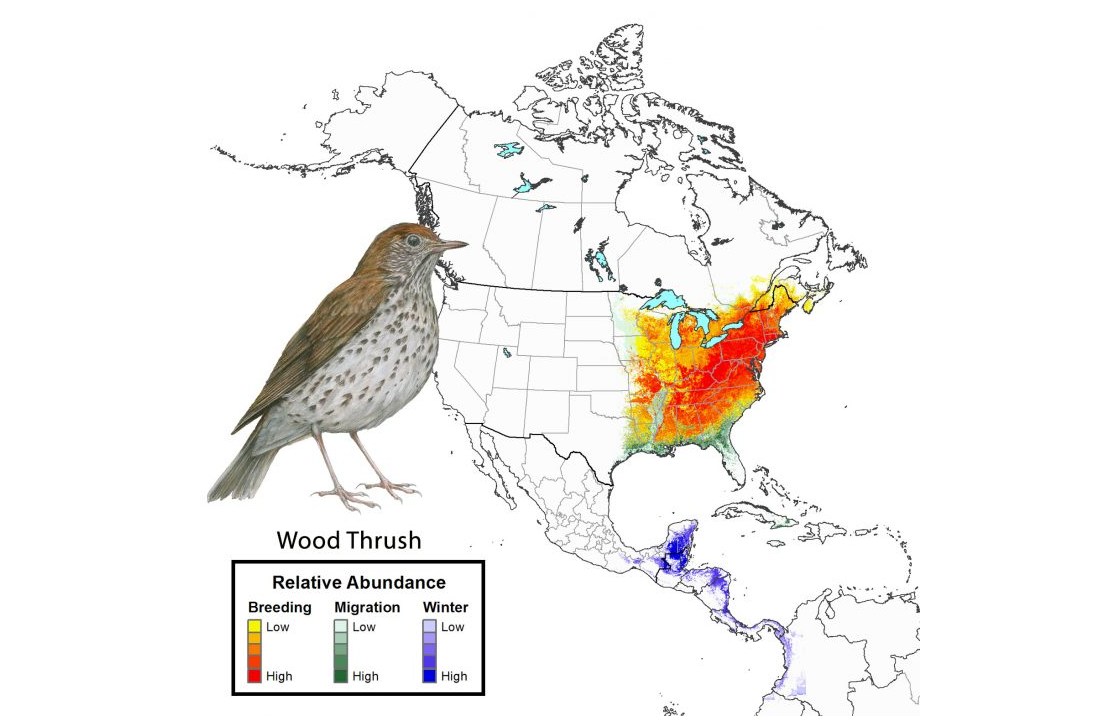
An indicator variable of the state of the population
I don’t know how many there are, but I do know where there are more and where there are less.
Sin embargo…

Animals move and hide (camouflage)
Nuestros nuestreos no son infalibles

Biologist are not super heroes. We make mistakes!
- Detectability and Imperfect detection concept
How the detection error occurs (Guillera‐Arroita 2016)
see ppt 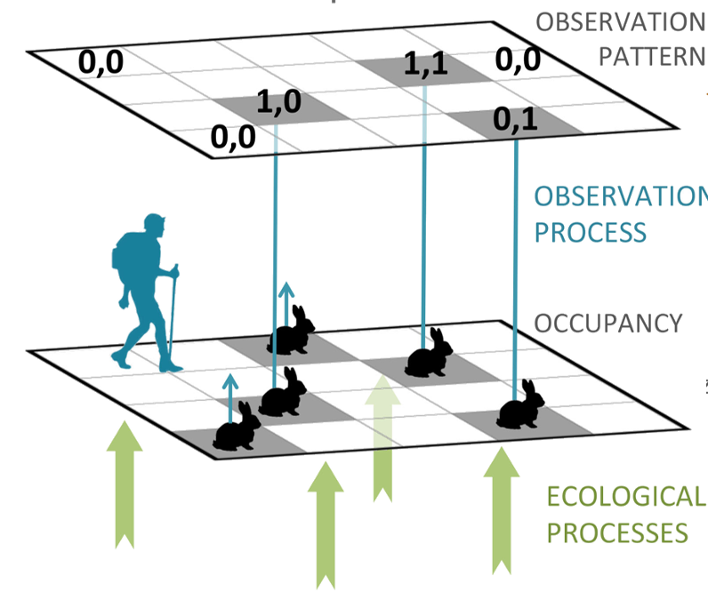
- It is an important error that must be considered in the sampling design!!!
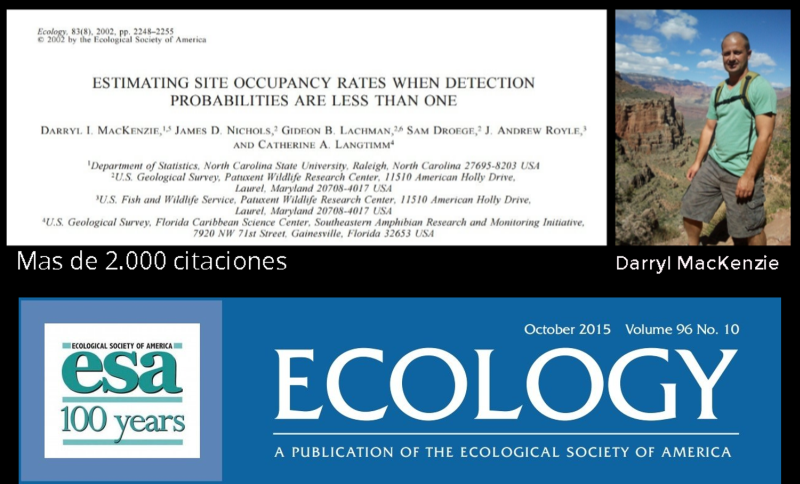
Mackenzie et al 2002, 2003 to the rescue
-unnoticed…
Book and presence program 2006
Mackenzie book
Book and presence program 2006
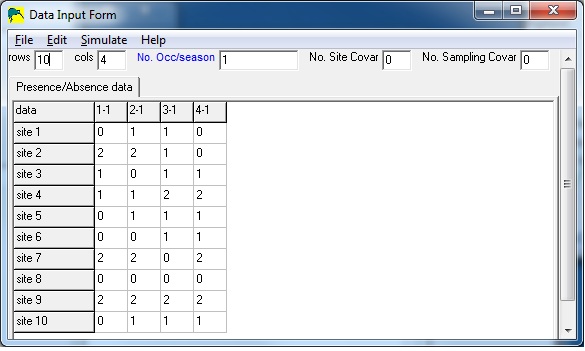
presence software
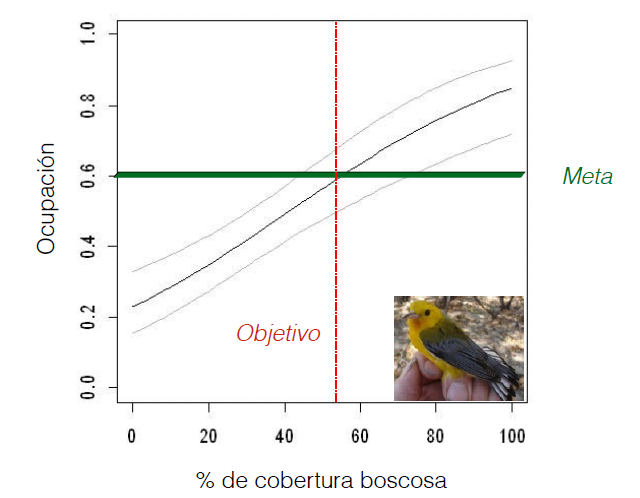
Mackenzie popularizes occupancy \((\psi)\) as a proxy of abundance taking into account detectability \((p)\)
Allows you to set goals and to monitor them over time.
A hierarchical (Bayesian) model
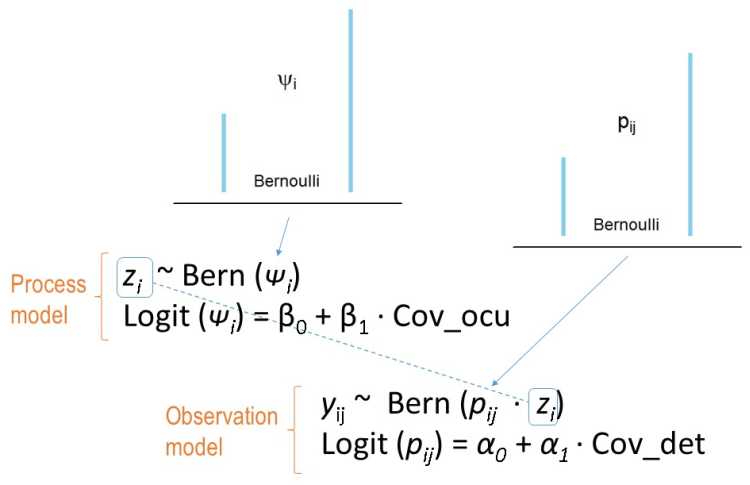
- Admits Covariates
Going Deep
Dragon-fly book (2015)
by Marc Kery. More than 700 pages clearly explaining where the theory comes from, in a tutorial style, starting with a basic level of R to advanced models and their implementation in R and the BUGS language.
Dragon-fly book Vol. 2 (2020)
 Dynamic and Advanced Models provides a synthesis of the state-of-the-art in hierarchical models for plant and animal distribution, also focusing on the complex and more advanced models currently available. The book explains all procedures in the context of hierarchical models that represent a unified approach to ecological research, thus taking the reader from design, through data collection, and into analyses using a very powerful way of synthesizing data.
Manos a la obra…