
Los datos de fuego
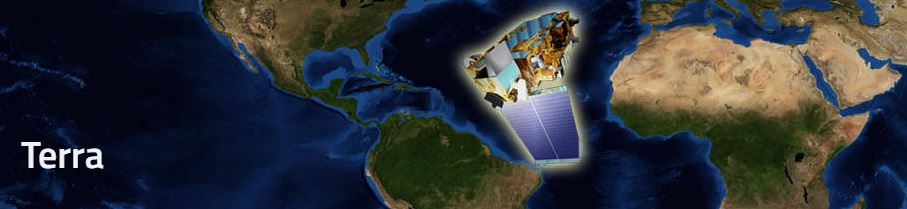
Los satélites Terra y Aqua han estado orbitando la tierra desde hace mas de 10 años. Unos de los sensores que poseen estos satélites MODIS ha registrando entre otros, los sitios con anomalías térmicas, las cuales equivalen a fuegos e incendios forestales. Gracias a la universidad de Maryland, estos datos han sido organizados en el repositorio FIRMS, de donde pueden ser facilmente descargados.
Hace unos días junto con Carlos Pedraza bajamos los datos de Colombia para ver su relación con el cambio de uso de la tierra y la ganaderia. Si bien los datos para Colombia están en un archivo manejable en terminos de tamaño, en algún momento pensé que seria buena idea hacer una animación para ver la evolución de los fuegos.
Ademas…que mejor excusa para hacer una animación, que aprender las nuevas funcionalidades de los paquetes SF y gganimate.
Aqui el Código
library(tidyverse) # dev ggplot version required: devtools::install_github("hadley/ggplot2")
library(sf)
library(ggmap)
library(gganimate) # devtools::install_github("dgrtwo/gganimate")
library(hrbrthemes) # devtools::install_github("hrbrmstr/hrbrthemes")
library(ggthemes)
library(raster)
library(lubridate)

Col_full<-getData('GADM', country='COL', level=1) #get colombia map
col_full_sf <- st_as_sf(Col_full) # convert to sf object
fuego <- st_read("C:/your_file_directory/fire_archive_M6_1285.shp")
fuego$fecha <- as.POSIXct(fuego$ACQ_DATE)
fuego$month <- month(fuego$fecha)
fuego$year <- year(fuego$fecha)
fuego$brillo <- as.vector(scale(fuego$BRIGHT_T31)+ 5)
fuego$by_day <- date(fuego$fecha)
fuego$by_week <- floor_date(date(fuego$fecha), "week")
fuego$by_month <- floor_date(date(fuego$fecha), "month")


fire_col_map <- ggplot() +
  geom_sf(data = col_full_sf, colour = "#ffffff20", fill = "#2d2d2d60", size = .1) +
  geom_sf(data = fuego, aes(colour = brillo, frame = by_month), size=1, alpha = .1) +
  scale_colour_gradient(low = "yellow", high = "red") +
  geom_text(data = fuego, aes(x=-78, y=15, label = by_month, frame = by_month), colour = "blue", size = 10) +
   labs(title = "Fires in Colombia", caption = "@dlizcano / Source: MODIS-NASA") # +

# Set animation interval as .25 seconds, create the gif.
# Go for a coffee or come back in 5 min...
animation::ani.options(interval = 0.09)
gganimate(fire_col_map, ani.width =  600, ani.height = 800, "fire2.gif", title_frame = TRUE)  #mp4 is avalable
Y este es el resultado
La idea original fue ver el impacto de los fuegos en la Orinoquia.

This work is licensed under a Creative Commons Attribution-ShareAlike 4.0 International License.
Leave a comment