
Deforestation Data
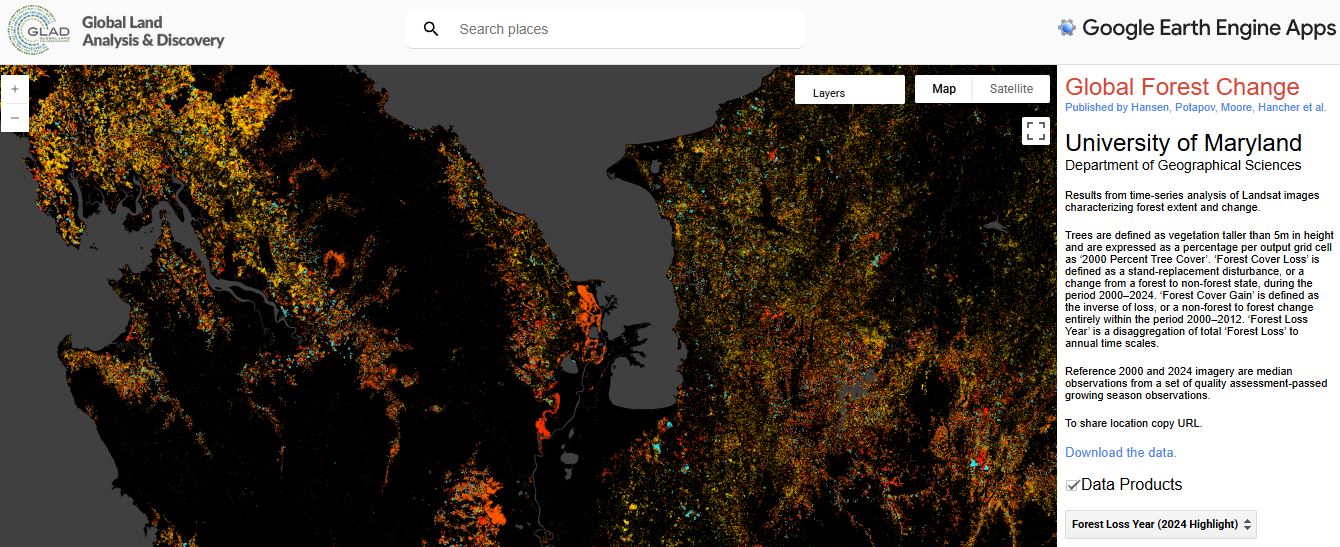
The University of Maryland’s Global Land Analysis and Discovery (GLAD) laboratory, in collaboration with Global Forest Watch (GFW), has released its latest global forest loss data. This annually updated dataset, which you can download here, provides a unique look at how forests are disappearing around the world.
Using Landsat satellite imagery, the data reveals detailed spatiotemporal trends—showing not just where and when forest loss is happening, but also the rate at which it’s occurring. This helps researchers, policymakers, and the public understand the dynamics of global deforestation and its impact on our planet.
Although this is a global dataset, I wanted to apply it to a specific area of interest: Los Katíos National Park in Colombia. This is a site where our team is actively working, installing camera traps to monitor wildlife. We’ve observed a recent increase in deforestation here, making it a perfect case study.
My goal was to use this deforestation data as a covariate in an occupancy analysis. This approach allows us to investigate the relationship between forest loss and the presence or absence of wildlife species, providing a more robust understanding of how habitat changes impact local ecosystems.
This also provided the perfect opportunity to test the new animation features of the tmap package.
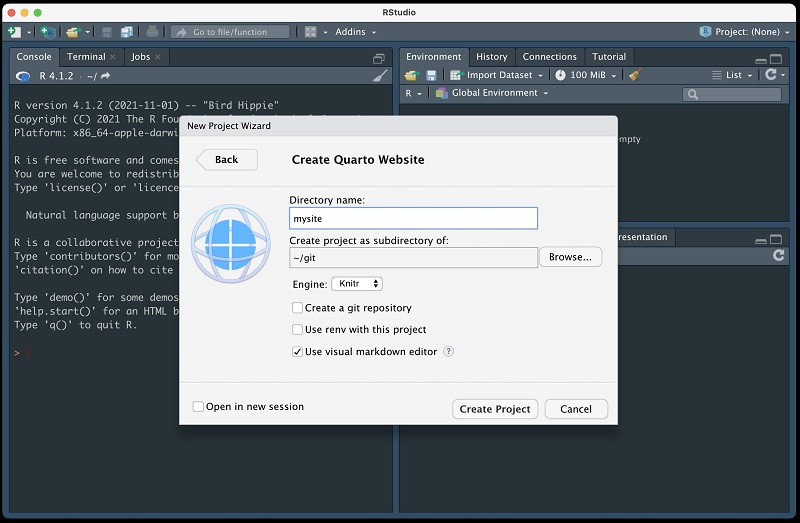
Below is R the code I used to download the boundaries of a national park using the wdpar package. This park boundary is then used as the area of interest (AOI) for the deforestation analysis with the gfcanalysis package.
Get the Data and Make the Analysis
This part download the park limit and makes the deforestation analysis.
library (gfcanalysis) # get Hansen data
library (sf) # make sf maps in R
library (wdpar) # get data from World Database on Protected Areas (WDPA)
library (tidyverse)

# directory to download Hansen Files
data_folder <- 'C:/tmp/Hansen_downloads/Katios'

# get all protected areas in Colombia
col_raw_pa_data <- wdpa_fetch(
  "COL", wait = TRUE, download_dir = data_folder
)

# clean Colombia data
# be patient... takes some time...
col_pa_data <- wdpa_clean(col_raw_pa_data)
# filter Katios National Park
Katios_NP <- col_pa_data %>% filter(NAME == "Los Katíos")

# add a buffer around to get a better context
buffered_Katios_NP <- st_buffer(Katios_NP, dist = 15000) # Buffer by 15 km

# Area of interest --- Katios National Park sf file
aoi <- buffered_Katios_NP

# Calculate the google server URLs for the tiles needed to cover the AOI
tiles <- calc_gfc_tiles(aoi)

# Check to see if these tiles are already present locally, and download them if
# they are not.
download_tiles(tiles, data_folder)

# Extract the GFC data for this AOI from the downloaded GFC tiles, mosaicing
# multiple tiles as necessary (if needed to cover the AOI), and saving  the
# output data to a GeoTIFF (can also save in ENVI format, Erdas format, etc.).
gfc_data <- extract_gfc(aoi, data_folder,
                        filename="C:/tmp/Hansen_downloads/Katios/Katios_extract.tif",
                        overwrite=TRUE)

###############################################################################
# Performing thresholding and calculate basic statistics
###############################################################################

# Calculate and save a thresholded version of the GFC product
gfc_thresholded <- threshold_gfc(gfc_data,
                                 forest_threshold=90,
                                 filename="C:/tmp/Hansen_downloads/Katios/Katios_extract_thresholded.tif",
                                 overwrite=TRUE)

# annualized layer stack of forest change
Katios_annual_stack <- annual_stack(gfc_thresholded)
Katios_annual_stack is a raster brick from the old raster package. So in the next part we convert that object to a SpatRaster object using the terra package and use that SpatRaster “stack” as input for the animation.
Make the Animation
library(tmap)
library(tmaptools)

# convert rasterbrick to terra
Katios_annual_stack_t <-  terra::rast(Katios_annual_stack)

# make the map and animate
Katios_deforest <- tm_shape(Katios_annual_stack_t) +
  tm_raster(palette  = c("#008000", "#ffa500", "#ff0000",
                    "#0000ff", "#ff00ff", "#c0c0c0", "#101010"),
            style = "cat",
            labels = c("Forest", "Non-forest",
                       "Forest loss", "Forest gain", "Loss and gain", "Water",
                       "No data")) +
  tm_animate(fps = 1) +
  tm_shape(Katios_NP) +
  tm_lines(
    #lwd = "strokelwd",
    lwd.scale = tm_scale_asis(values.scale = .5),
    col = "black")

# save animation
tmap_animation(Katios_deforest, "C:/tmp/Hansen_downloads/Katios/Katios_deforest_1fps.mp4")
We can save the animation as .gif as well.
Here the Animation as a Video
It’s disheartening to see the rapid rise in deforestation since 2015, especially the dramatic explosion of forest loss within Los Katios National Park in 2021. This trend is a clear and alarming threat to the park’s biodiversity and ecological integrity.

This work is licensed under a Creative Commons Attribution-ShareAlike 4.0 International License.


Leave a comment